The NCA Overlay: Regulatory Review or Regulatory Tax?
A Data-Driven Analysis of Philadelphia's Neighborhood Commercial Area Overlay and Its Impact on Food & Beverage Businesses
Prepared by Jon Geeting with Claude AI | February 2026
Executive Summary
Philadelphia's Neighborhood Commercial Area (NCA) overlay requires food and beverage businesses to obtain a special exception from the Zoning Board of Adjustment — even on parcels where the base zoning code already permits restaurants by right. This analysis examines 1,075 F&B business licenses, 250 F&B zoning appeals, and 29,904 property parcels across seven commercial corridors to measure the overlay's actual impact.
(Note: Old City was initially included as a by-right control corridor, but subsequent research revealed it operates under the CTR Center City Overlay District, which also requires special exceptions for restaurants. Old City data is retained for transparency but should be interpreted with that caveat.)
Key findings:
- 91% of F&B special exception hearings occur on CMX parcels where the base zoning already allows restaurant use. The NCA overlay roughly doubles the number of restaurants forced to ZBA.
- 97.1% of these cases are approved. The ZBA is rubber-stamping applications the zoning code already permits.
- Restaurants that go by-right open in a median of 5 months. Restaurants forced through ZBA take 10 months — a penalty of 5 extra months. On NCA corridors specifically, the ZBA path adds 7 months.
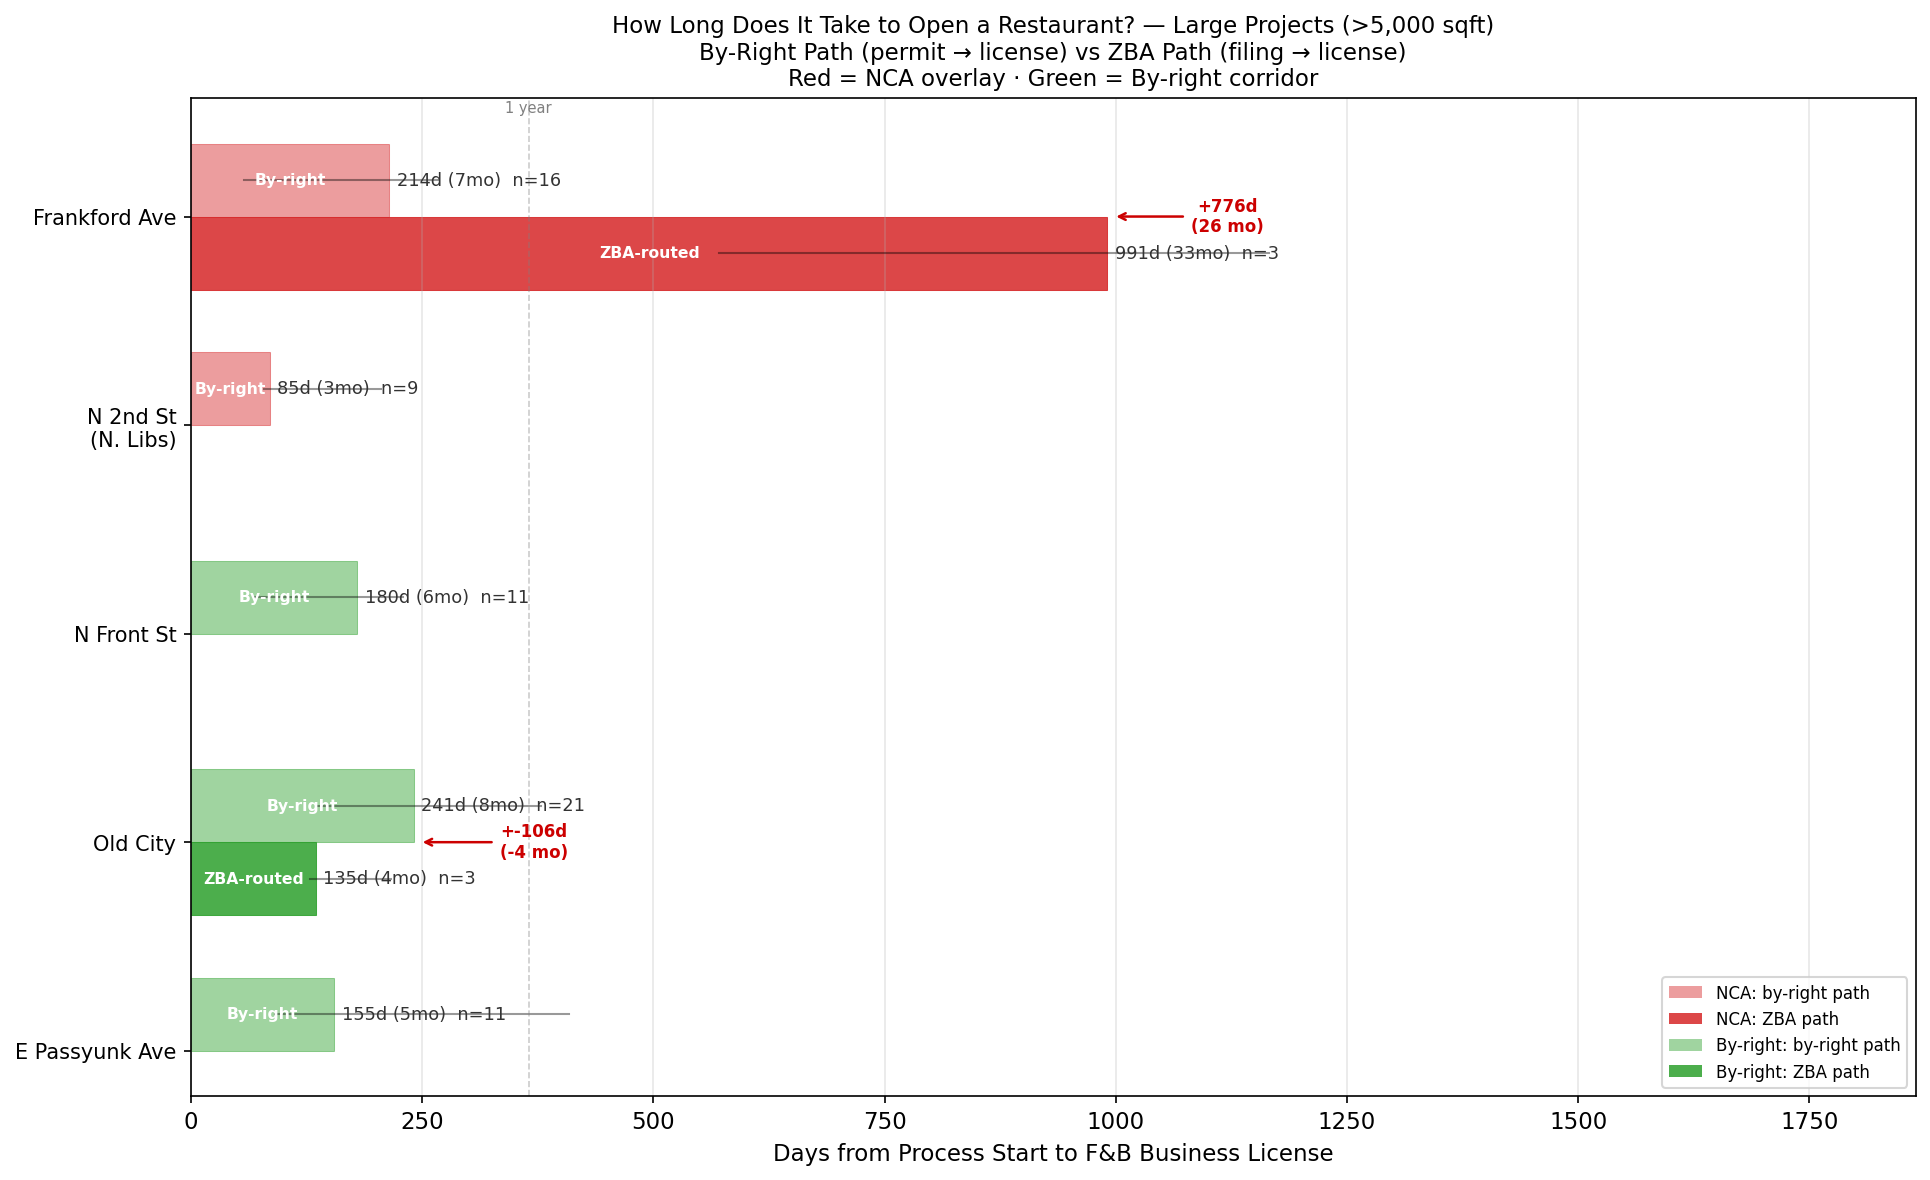
- For large projects on NCA corridors, the gap widens dramatically: 33 months vs 7 months by-right.
- The overlay imposes an estimated $650,000–$1.95 million in aggregate legal and hearing costs.
- At least 13 restaurants won ZBA approval on NCA corridors but never opened.
I. The Problem
What the NCA Overlay Does
Philadelphia's zoning code divides commercial land into CMX districts (CMX-1 through CMX-5) that allow a range of commercial uses, including restaurants, by right. The NCA overlay modifies this: within its boundaries, certain uses that would otherwise be permitted — most notably food and beverage establishments — instead require a special exception from the Zoning Board of Adjustment.
A special exception is not a variance. The applicant does not need to prove hardship or demonstrate that the zoning code creates an unreasonable burden. They must simply appear before the ZBA, typically with legal counsel, and demonstrate that the proposed use meets the overlay's conditions. In practice, the ZBA approves nearly all of them.
Why This Matters
The NCA overlay affects some of Philadelphia's most economically dynamic corridors: Frankford Avenue, East Girard Avenue, and North 2nd Street in Northern Liberties. Every month of regulatory delay represents lost revenue for the business owner, lost wages for workers, lost tax revenue for the city, and lost vitality for the corridor.
II. Study Design and Data
Corridors
This analysis compares four NCA-regulated corridors against three comparison corridors:
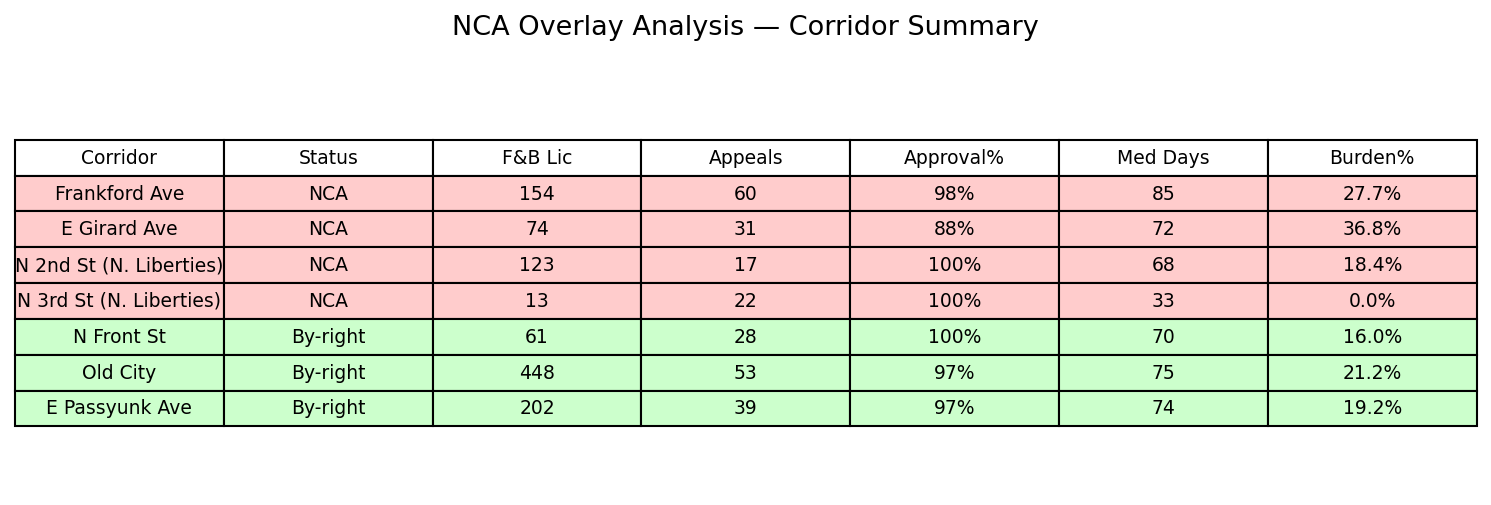
| Corridor | Status | F&B Licenses | F&B ZBA Appeals |
|---|---|---|---|
| Frankford Ave | NCA overlay | 154 | 60 |
| E Girard Ave | NCA overlay | 74 | 30 |
| N 2nd St (N. Liberties) | NCA overlay | 123 | 17 |
| N 3rd St (N. Liberties) | NCA overlay | 13 | 22 |
| E Passyunk Ave | By-right | 202 | 39 |
| Old City | CTR overlay* | 448 | 51 |
| N Front St | By-right | 61 | 28 |
*Old City operates under the CTR (Center City) Overlay District. See Methodology Notes for details.
Data Sources
- Business licenses (2007–2025): 3,050 licenses on study corridors, 1,075 F&B.
- ZBA appeals (2007–2025): 787 appeals on study corridors, 250 F&B use appeals.
- OPA property records: 29,904 parcels matched at a 99.7% rate.
- L&I permits: 65,521 building and zoning permits for timeline reconstruction.
- 311 complaints and L&I violations: Quality-of-life metrics.
- BID boundaries and NCA overlay polygon: GeoJSON shapefiles for spatial classification.
III. Findings
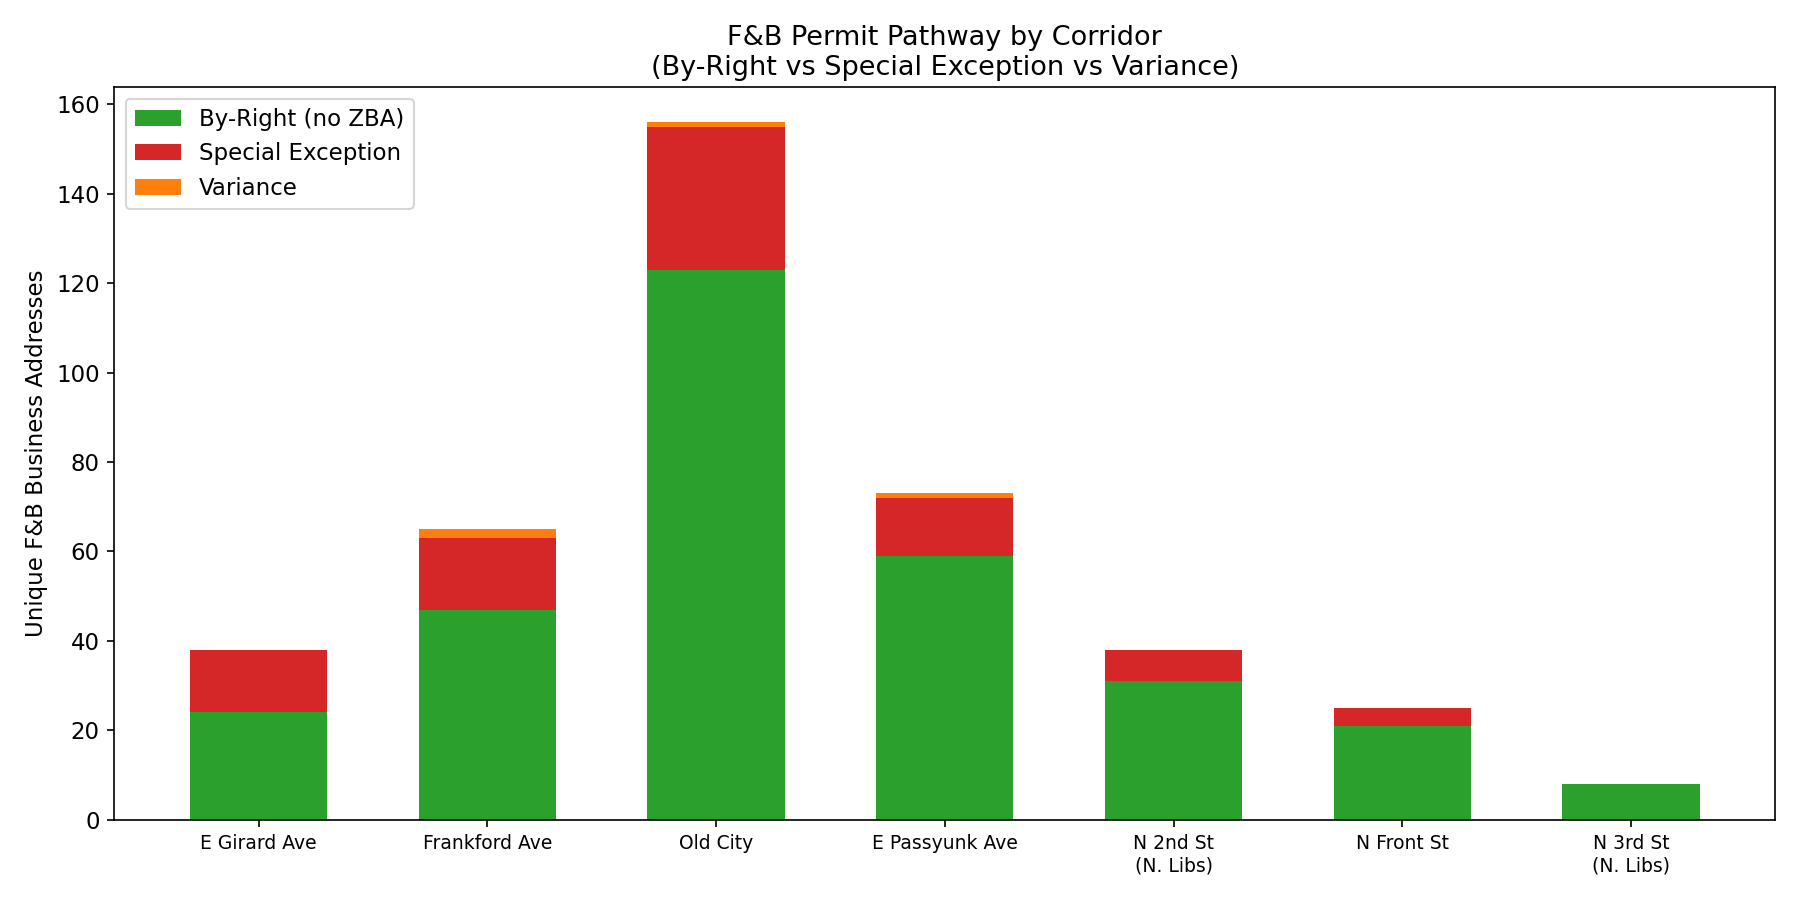
Finding 1: The NCA Overlay Is the Primary Driver of F&B ZBA Hearings
| Root Cause | Appeals | Share |
|---|---|---|
| CMX zones (base zoning permits restaurant use) | 227 | 91% |
| Base zoning-driven (residential zones on corridor) | 13 | 5% |
| Other / unknown | 10 | 4% |
The NCA overlay roughly doubles the number of F&B businesses that must go to ZBA on these corridors.
| Restaurant Type | Appeals | Share | Would need SE without NCA? |
|---|---|---|---|
| Sit-down | 36 | 31% | No — by-right in CMX |
| Take-out / prepared food | 38 | 32% | Yes — requires SE under base CMX |
| Unknown (no description) | 44 | 37% | Likely a mix of both |
Removing the NCA overlay would eliminate approximately 57 of 118 (48%) special exception hearings on NCA corridors.
Finding 2: The ZBA Approves 97% of Cases
Of 207 decided cases: 201 approved (97.1%), 6 denied (2.9%). On NCA corridors: 107 of 111 approved (96.4%), just 4 denials. On Frankford Ave: 32 out of 32 sit-down restaurants approved (100%).
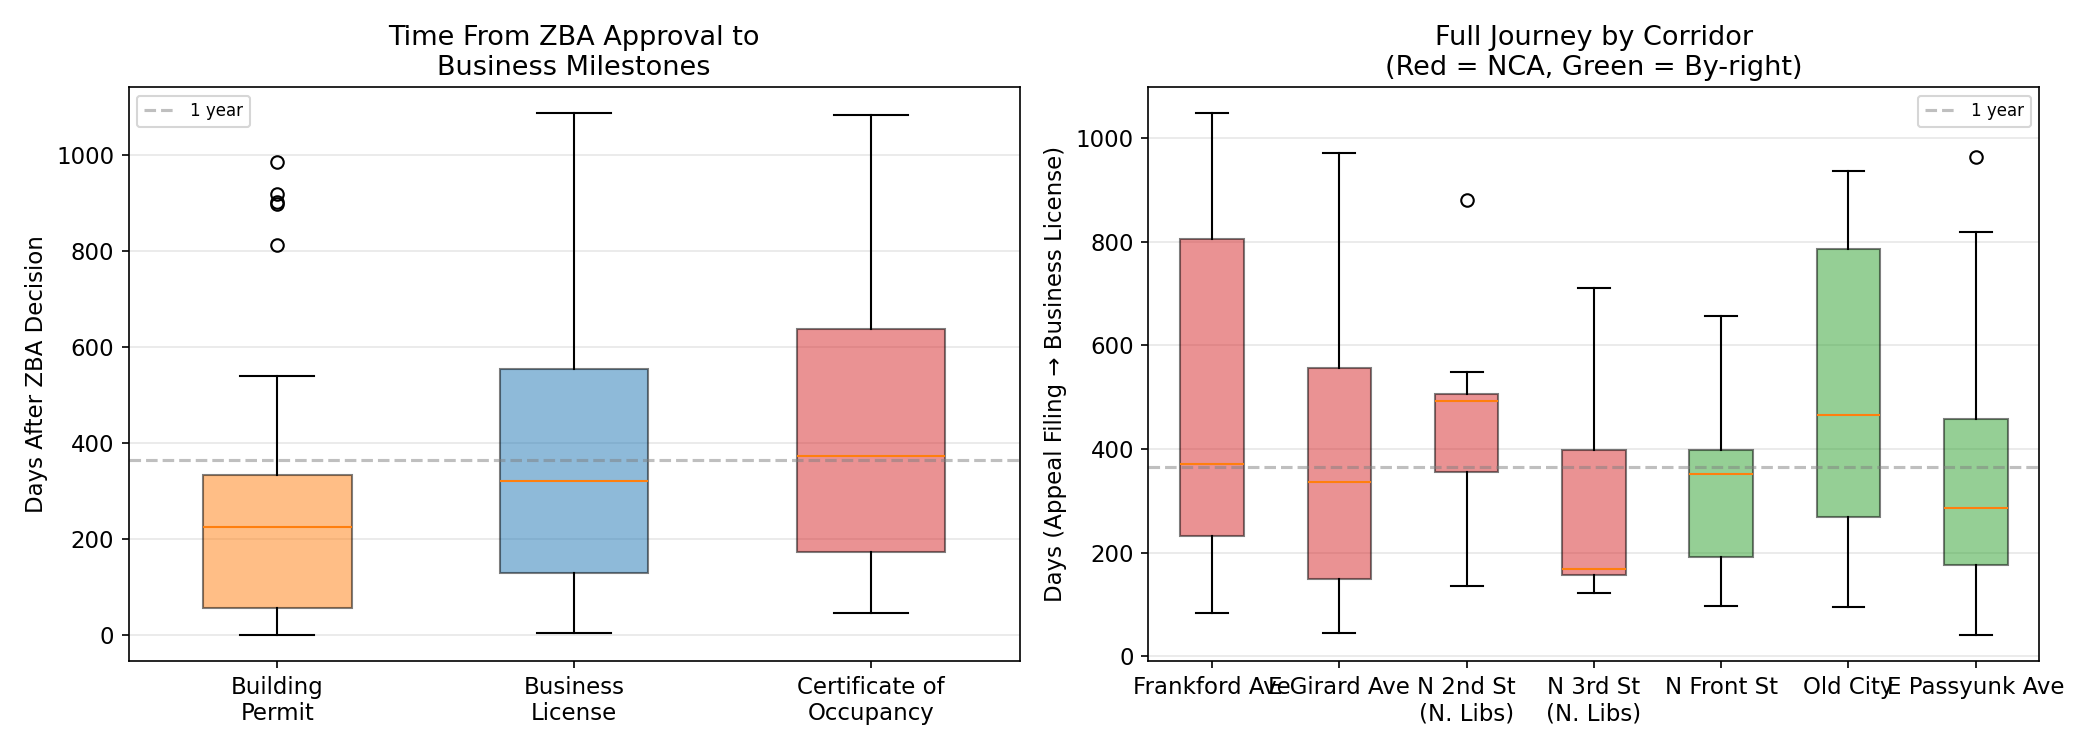
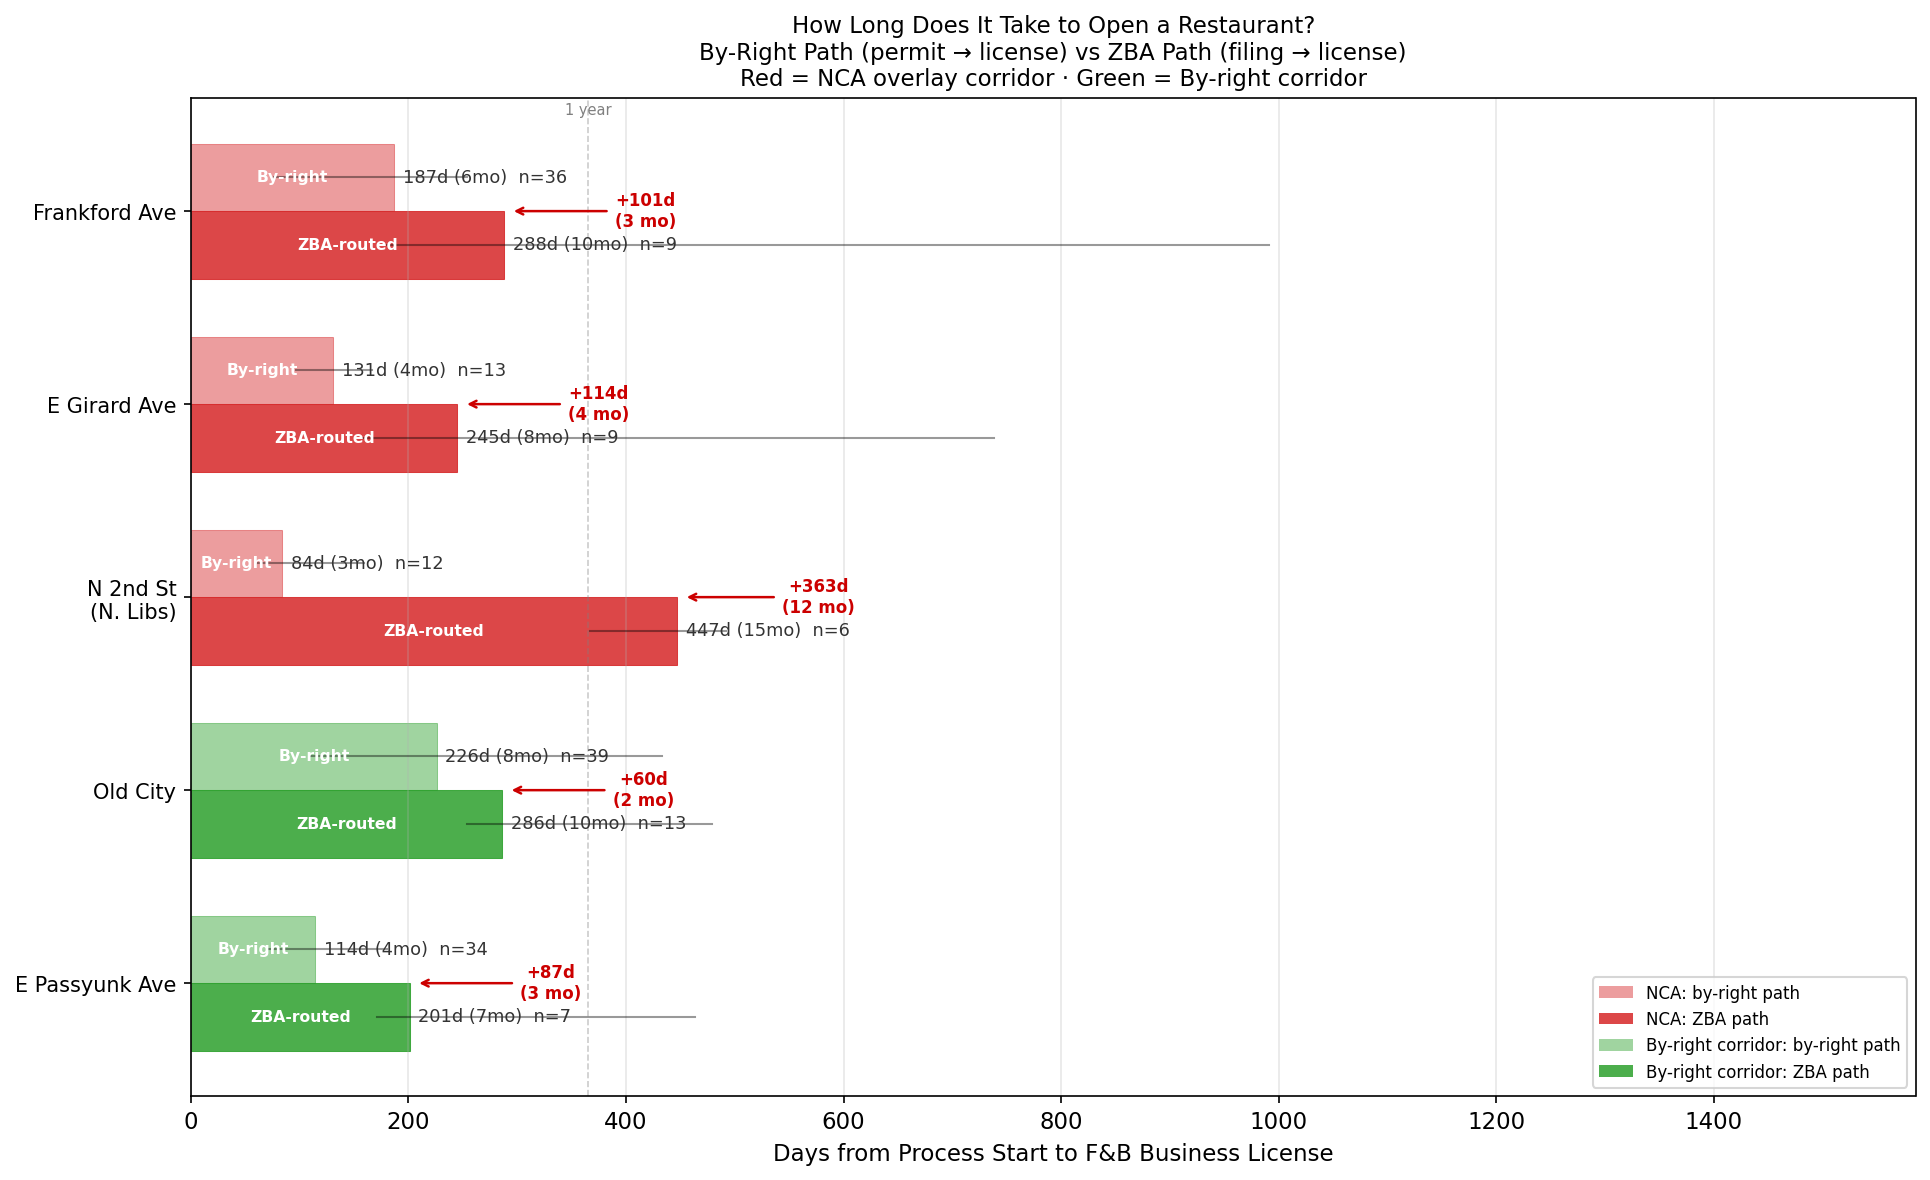
Finding 3: The Overlay Adds 3–12 Months to Opening
| Path | Median | n |
|---|---|---|
| By-right (permit to BL) | 150 days (5 months) | 147 |
| ZBA-routed (filing to BL) | 298 days (10 months) | 51 |
| Gap | +148 days (5 months) |
On NCA corridors: 355 days (12 months) via ZBA vs 143 days by-right — a penalty of 7 months.
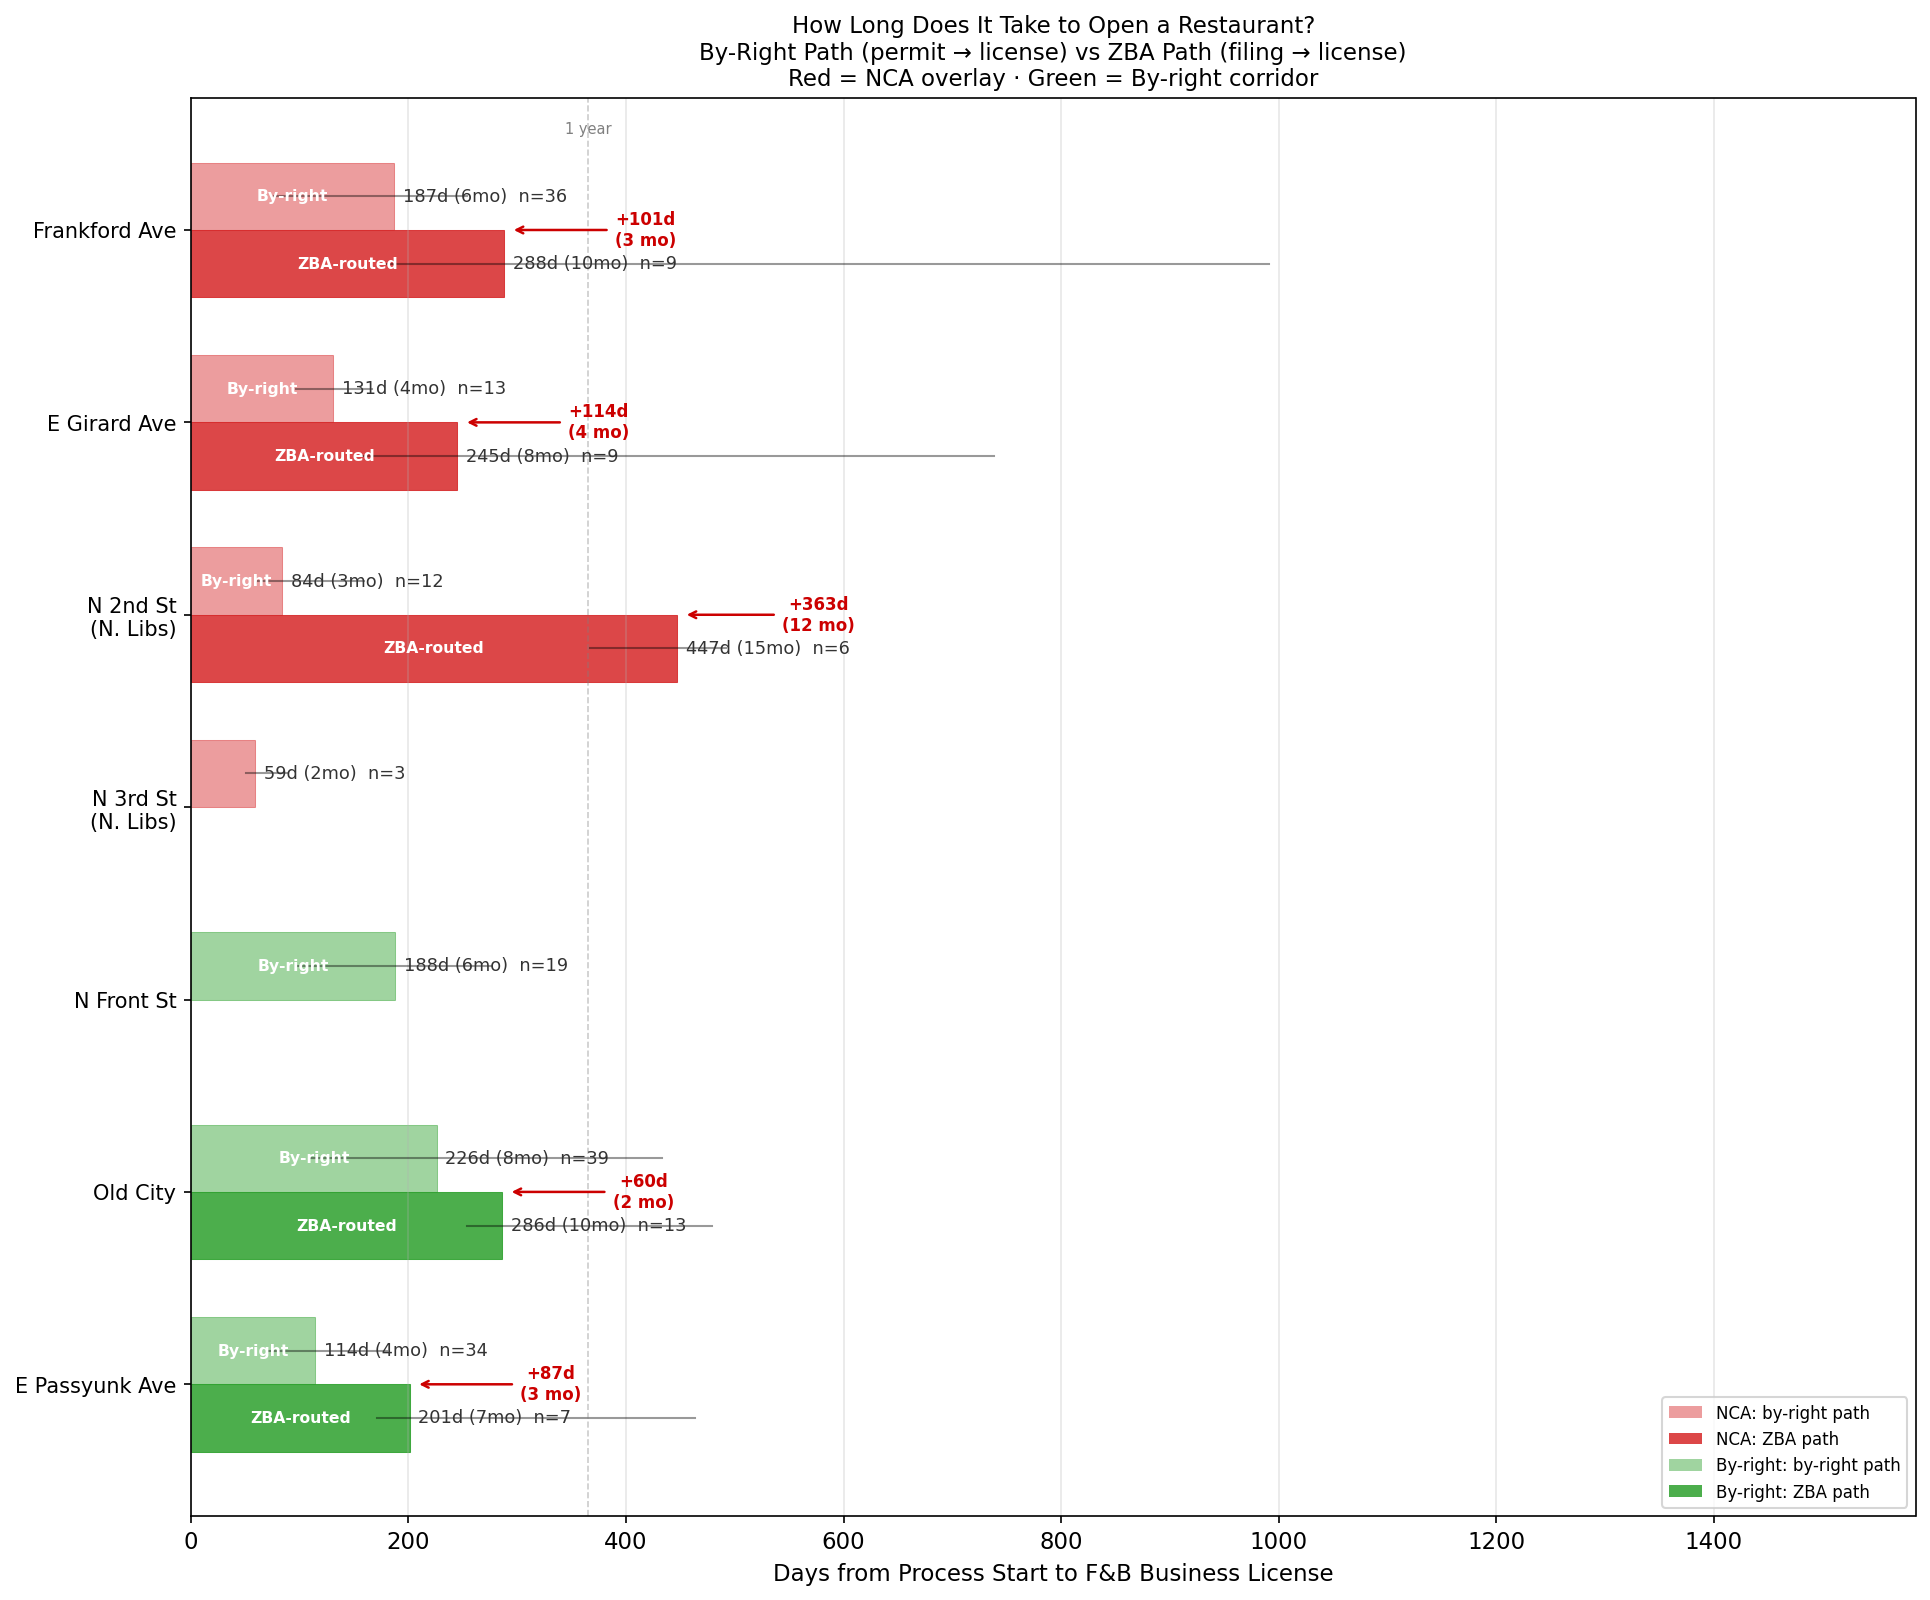
| Corridor | Status | By-Right | ZBA Path | Gap |
|---|---|---|---|---|
| Frankford Ave | NCA | 184d (6 mo), n=35 | 311d (10 mo), n=10 | +127d (4 mo) |
| E Girard Ave | NCA | 128d (4 mo), n=12 | 245d (8 mo), n=9 | +117d (4 mo) |
| N 2nd St | NCA | 83d (3 mo), n=11 | 447d (15 mo), n=6 | +364d (12 mo) |
| E Passyunk Ave | By-right | 114d (4 mo), n=34 | 201d (7 mo), n=7 | +87d (3 mo) |
| Old City | CTR* | 212d (7 mo), n=35 | 286d (10 mo), n=17 | +74d (2 mo) |
Finding 4: Frankford Avenue — A Natural Experiment
The NCA overlay covers only the east side of Frankford Ave. Same street, same neighborhood — different rules.
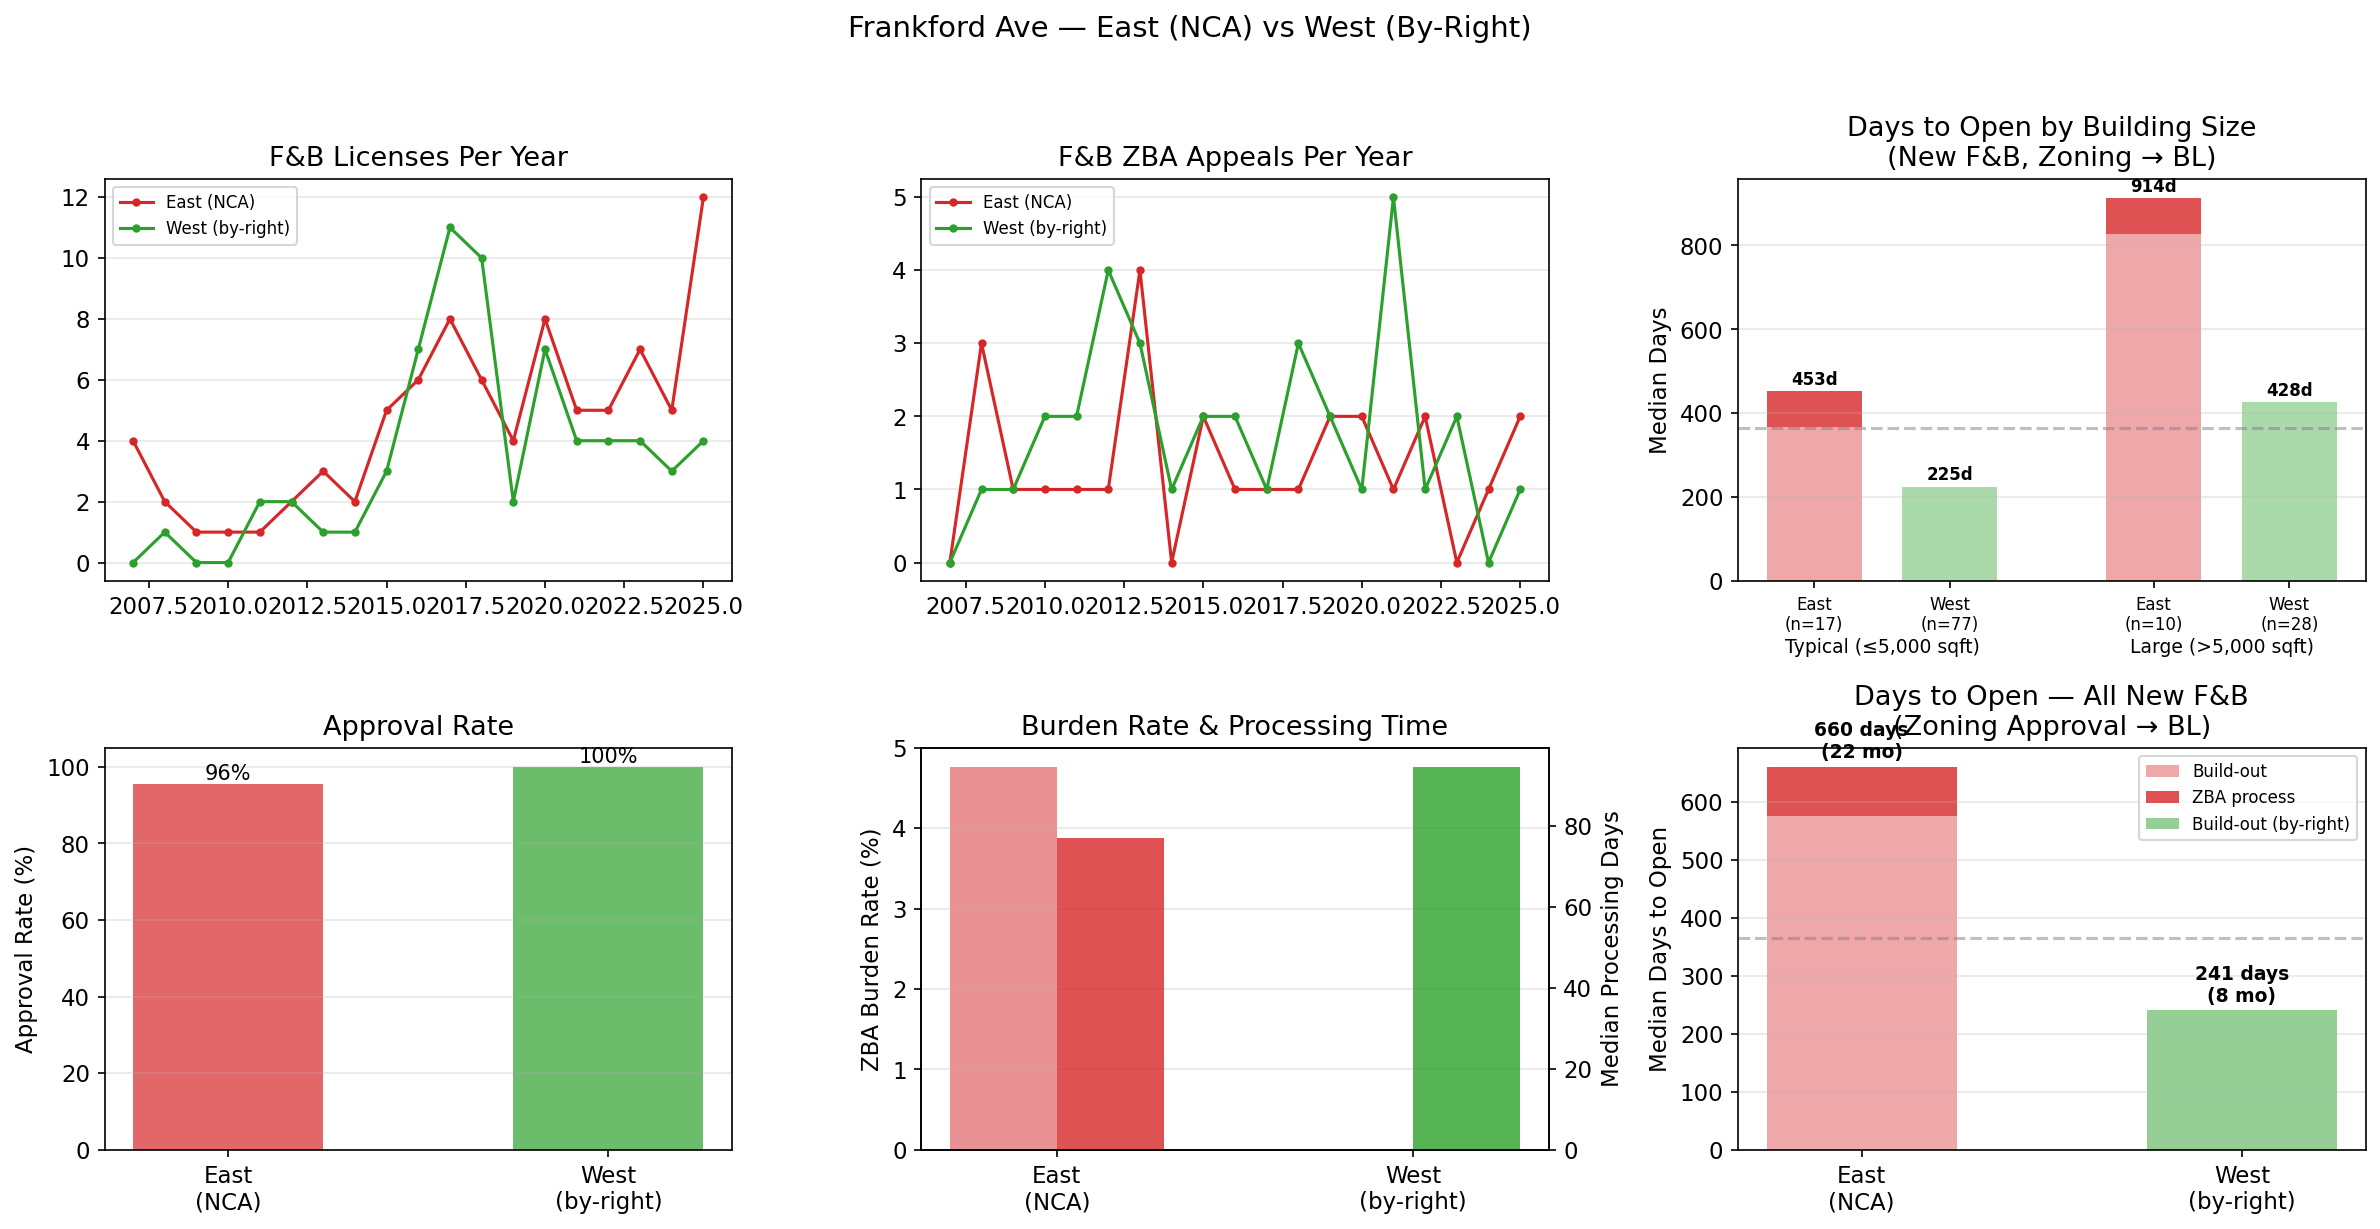
| East (NCA) | West (By-Right) | |
|---|---|---|
| Unique F&B addresses | 42 | 23 |
| Needed ZBA | 12 (29%) | 6 (26%) |
| ZBA queue (median) | 77 days | 94 days |
| ZBA approval rate | 96% | 100% |
- Typical east-side restaurant (NCA): ~453 days (15.1 months)
- Typical west-side restaurant (by-right): 225 days (7.5 months)
- Difference: ~228 extra days (7.6 months)
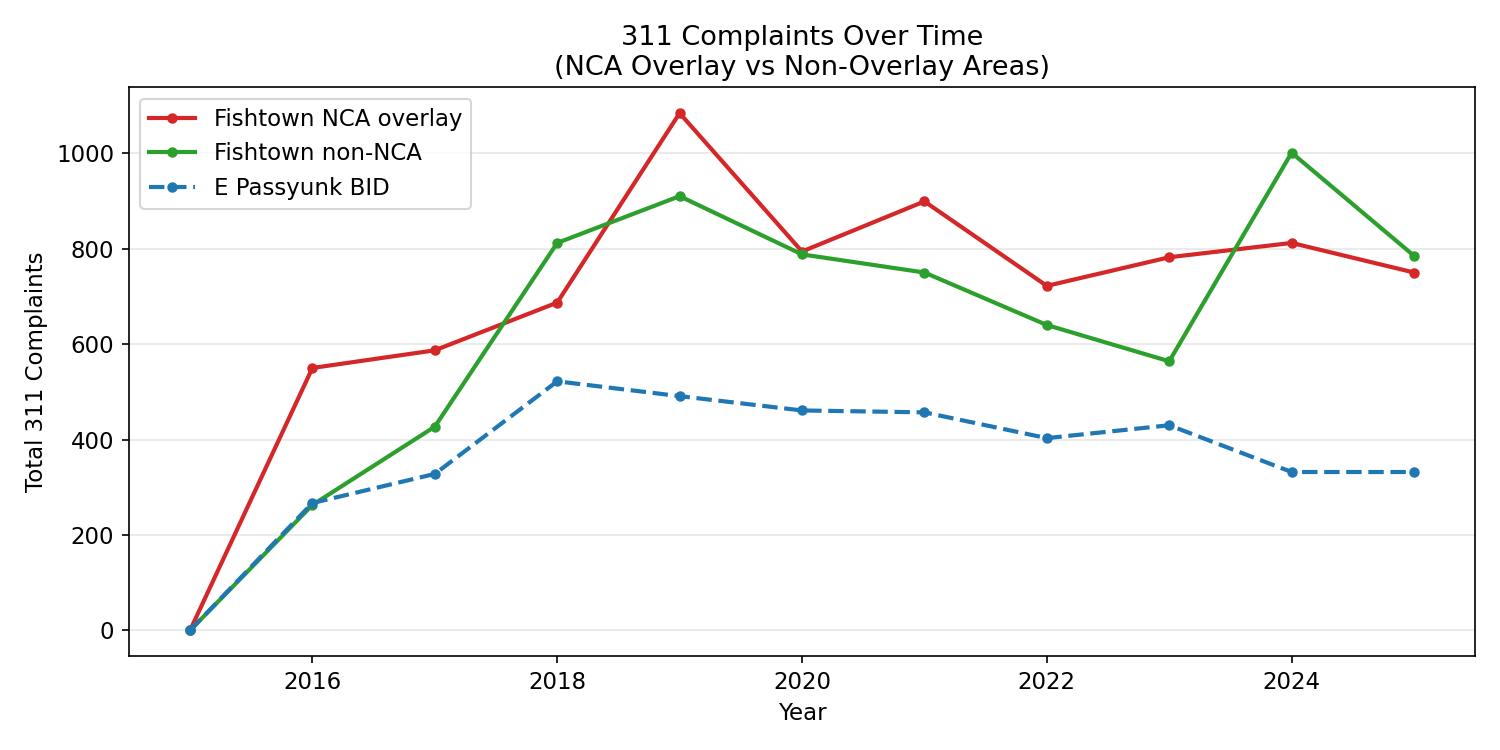
Finding 5: The Overlay Doesn't Improve Quality of Life
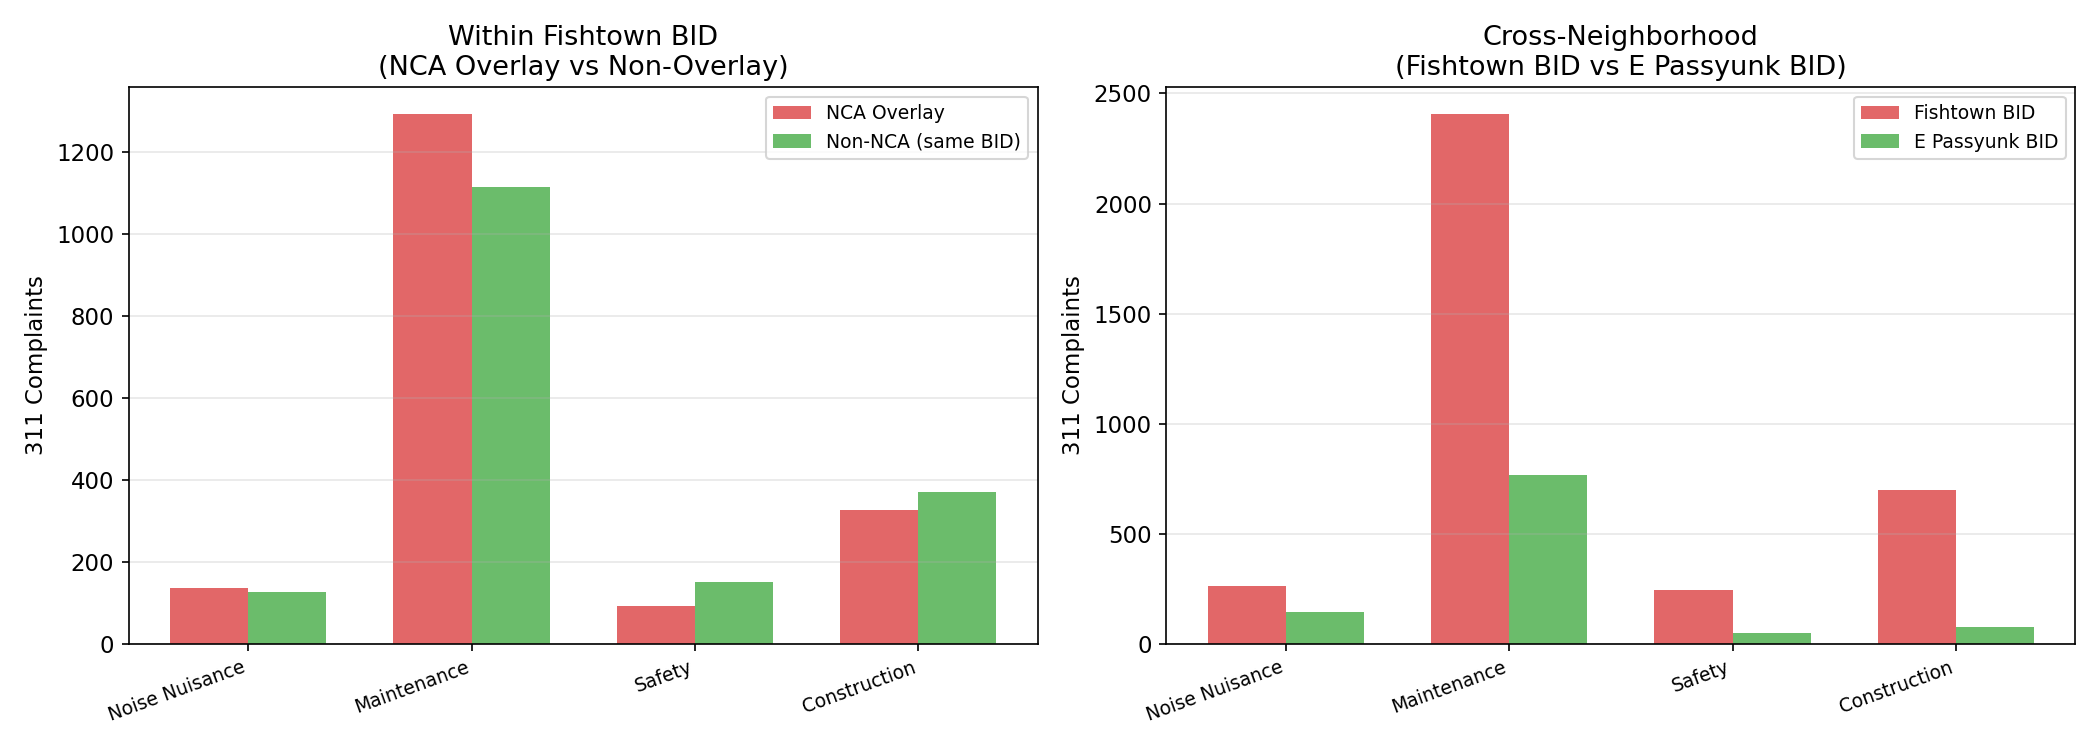
| Category | NCA Area | Non-NCA Area |
|---|---|---|
| Noise/nuisance | 135 | 127 |
| Maintenance | 1,294 | 1,114 |
| Safety | 91 | 150 |
| Construction | 325 | 371 |
Complaint rates are comparable. East Passyunk — a by-right corridor with 202 F&B businesses — does not have worse outcomes.
Finding 6: The Financial Cost
| Low | Mid | High | |
|---|---|---|---|
| Cost per hearing | $5,000 | $10,000 | $15,000 |
| All NCA F&B appeals (130) | $650,000 | $1,300,000 | $1,950,000 |
| NCA-only sit-down (~57) | $285,000 | $570,000 | $855,000 |
Finding 7: The Overlay Deters Restaurants That Never Open
13 restaurants won ZBA approval on NCA corridors but never opened. This count is conservative — it doesn't include restaurants deterred before filing.
Finding 8: Some Businesses Discover Zoning Requirements After Opening
We identified 7 cases on NCA corridors where a business license was issued before the ZBA appeal was filed:
- Kissaten (241 E Girard) — BL July 2023, special exception filed 26 days later, still in process 2+ years later.
- N12 Walnut (1514–16 Frankford) — Opened May 2016, ZBA filing 92 days later, dismissed as moot.
- Ekta Indian Cuisine (250 E Girard) — Opened June 2008, expansion filing 324 days later.
IV. The Burden Rate
| Corridor | Status | Burden Rate |
|---|---|---|
| E Girard Ave | NCA | 36.8% |
| Frankford Ave | NCA | 27.7% |
| Old City | CTR* | 21.2% |
| E Passyunk Ave | By-right | 19.2% |
| N 2nd St | NCA | 18.4% |
| N Front St | By-right | 16.0% |
| N 3rd St | NCA | 0.0% |
NCA corridors have higher burden rates overall (26.2% vs 20.5% for by-right). About 26% of NCA addresses have a prior approved SE, meaning turnkey operators may not need new hearings — but new conversions bear the full burden.
V. Recommendations
- Remove the NCA special exception requirement for sit-down restaurants in CMX zones. Eliminates ~57 unnecessary hearings, saves 3–12 months per restaurant, saves $5K–$15K per establishment.
- Reform the take-out restaurant special exception citywide. Take-out restaurants are approved at the same near-universal rate. Making them by-right in CMX zones would reduce ZBA burden citywide.
- If full removal isn't feasible, narrow the scope: exempt small restaurants, convert to administrative review, or establish a presumption of approval.
- Publish transparent data on ZBA outcomes. The 97% approval rate is not widely known.
Charts
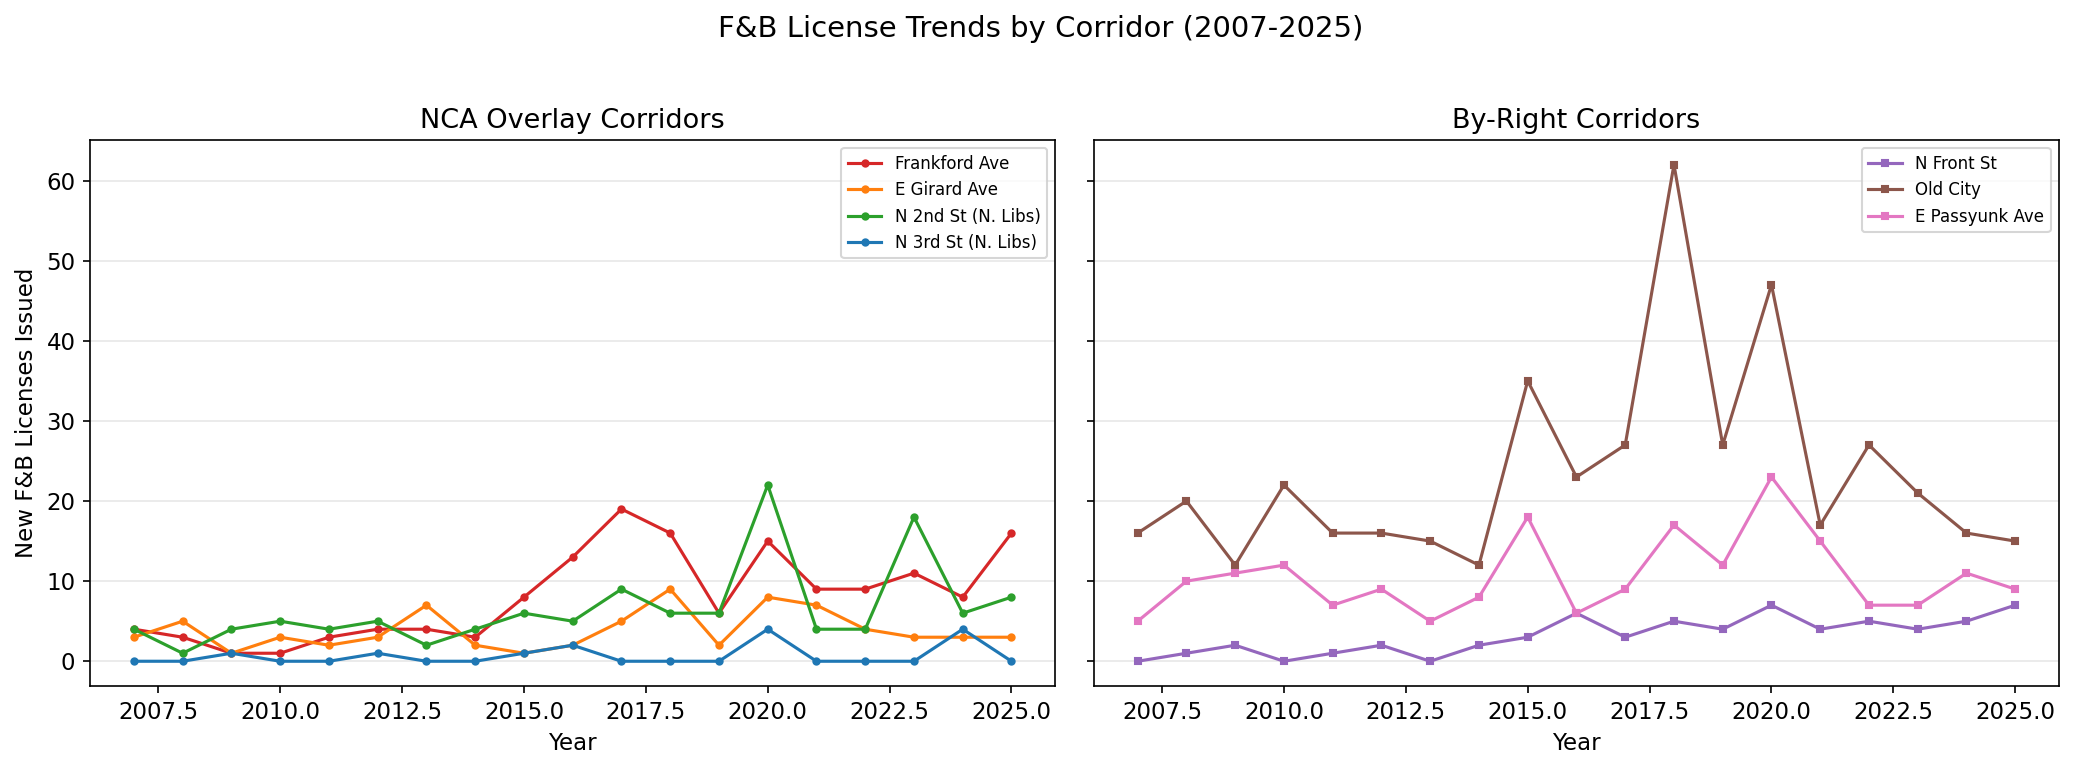
F&B Permitting Trends
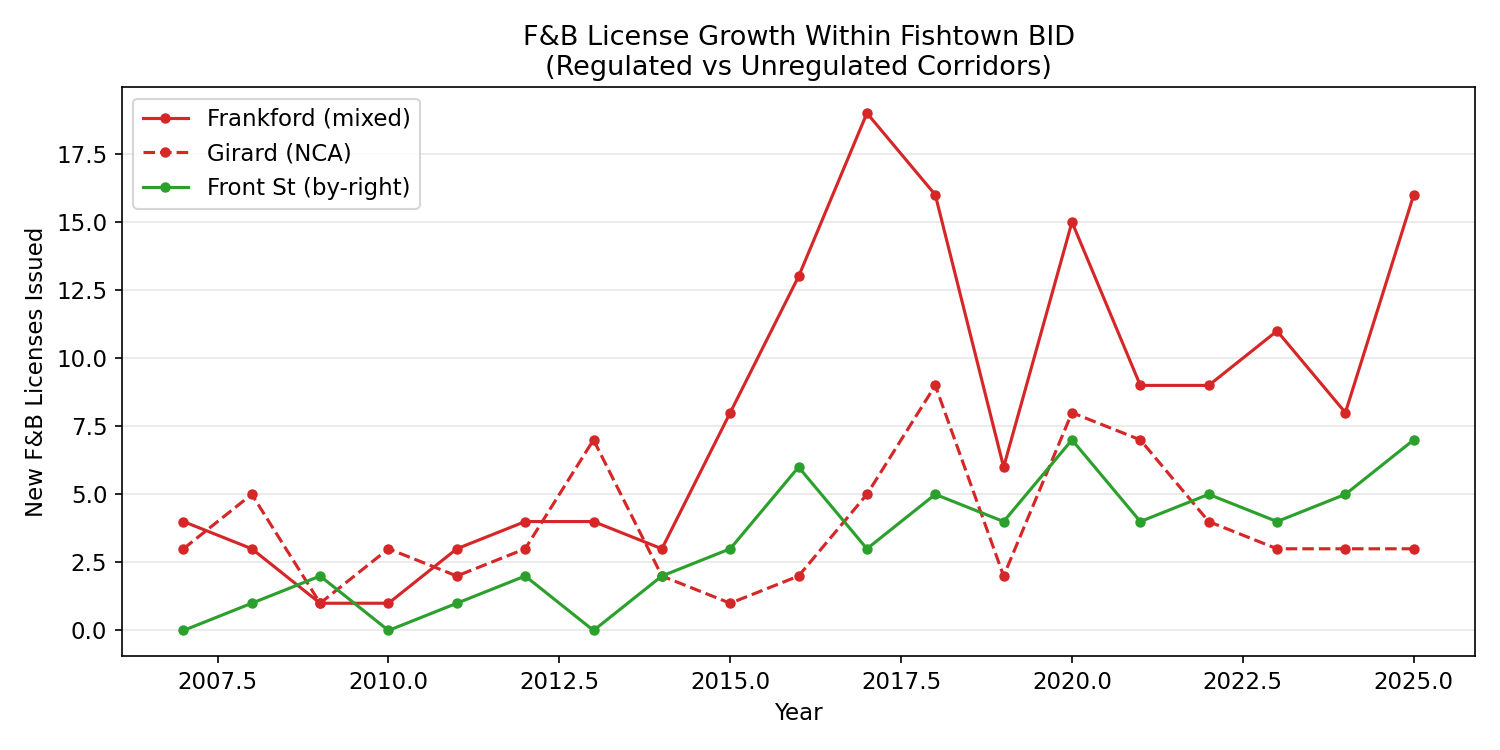
Fishtown BID F&B License Trends
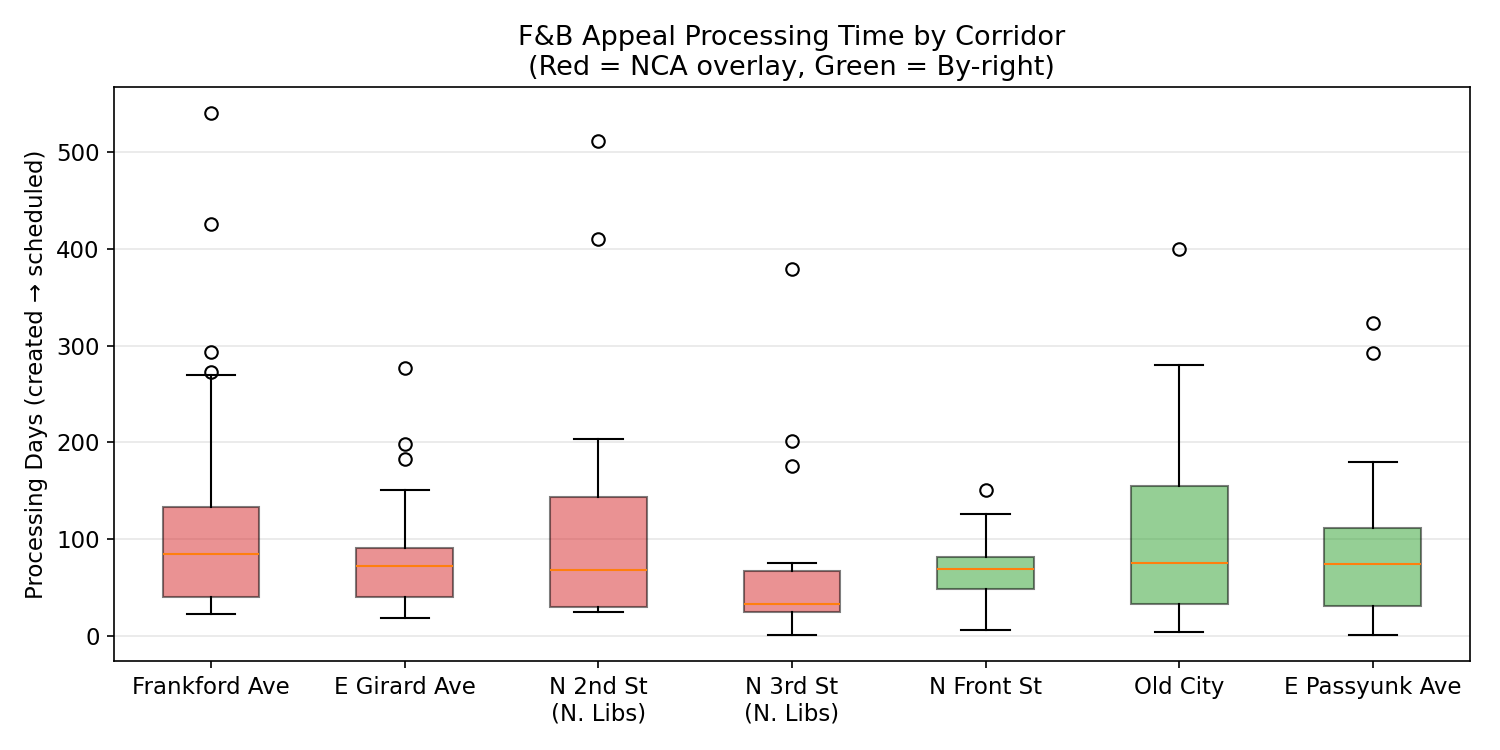
ZBA Processing Time by Pathway
ZBA to Opening Timeline
Opening Path Comparison (All Sizes)
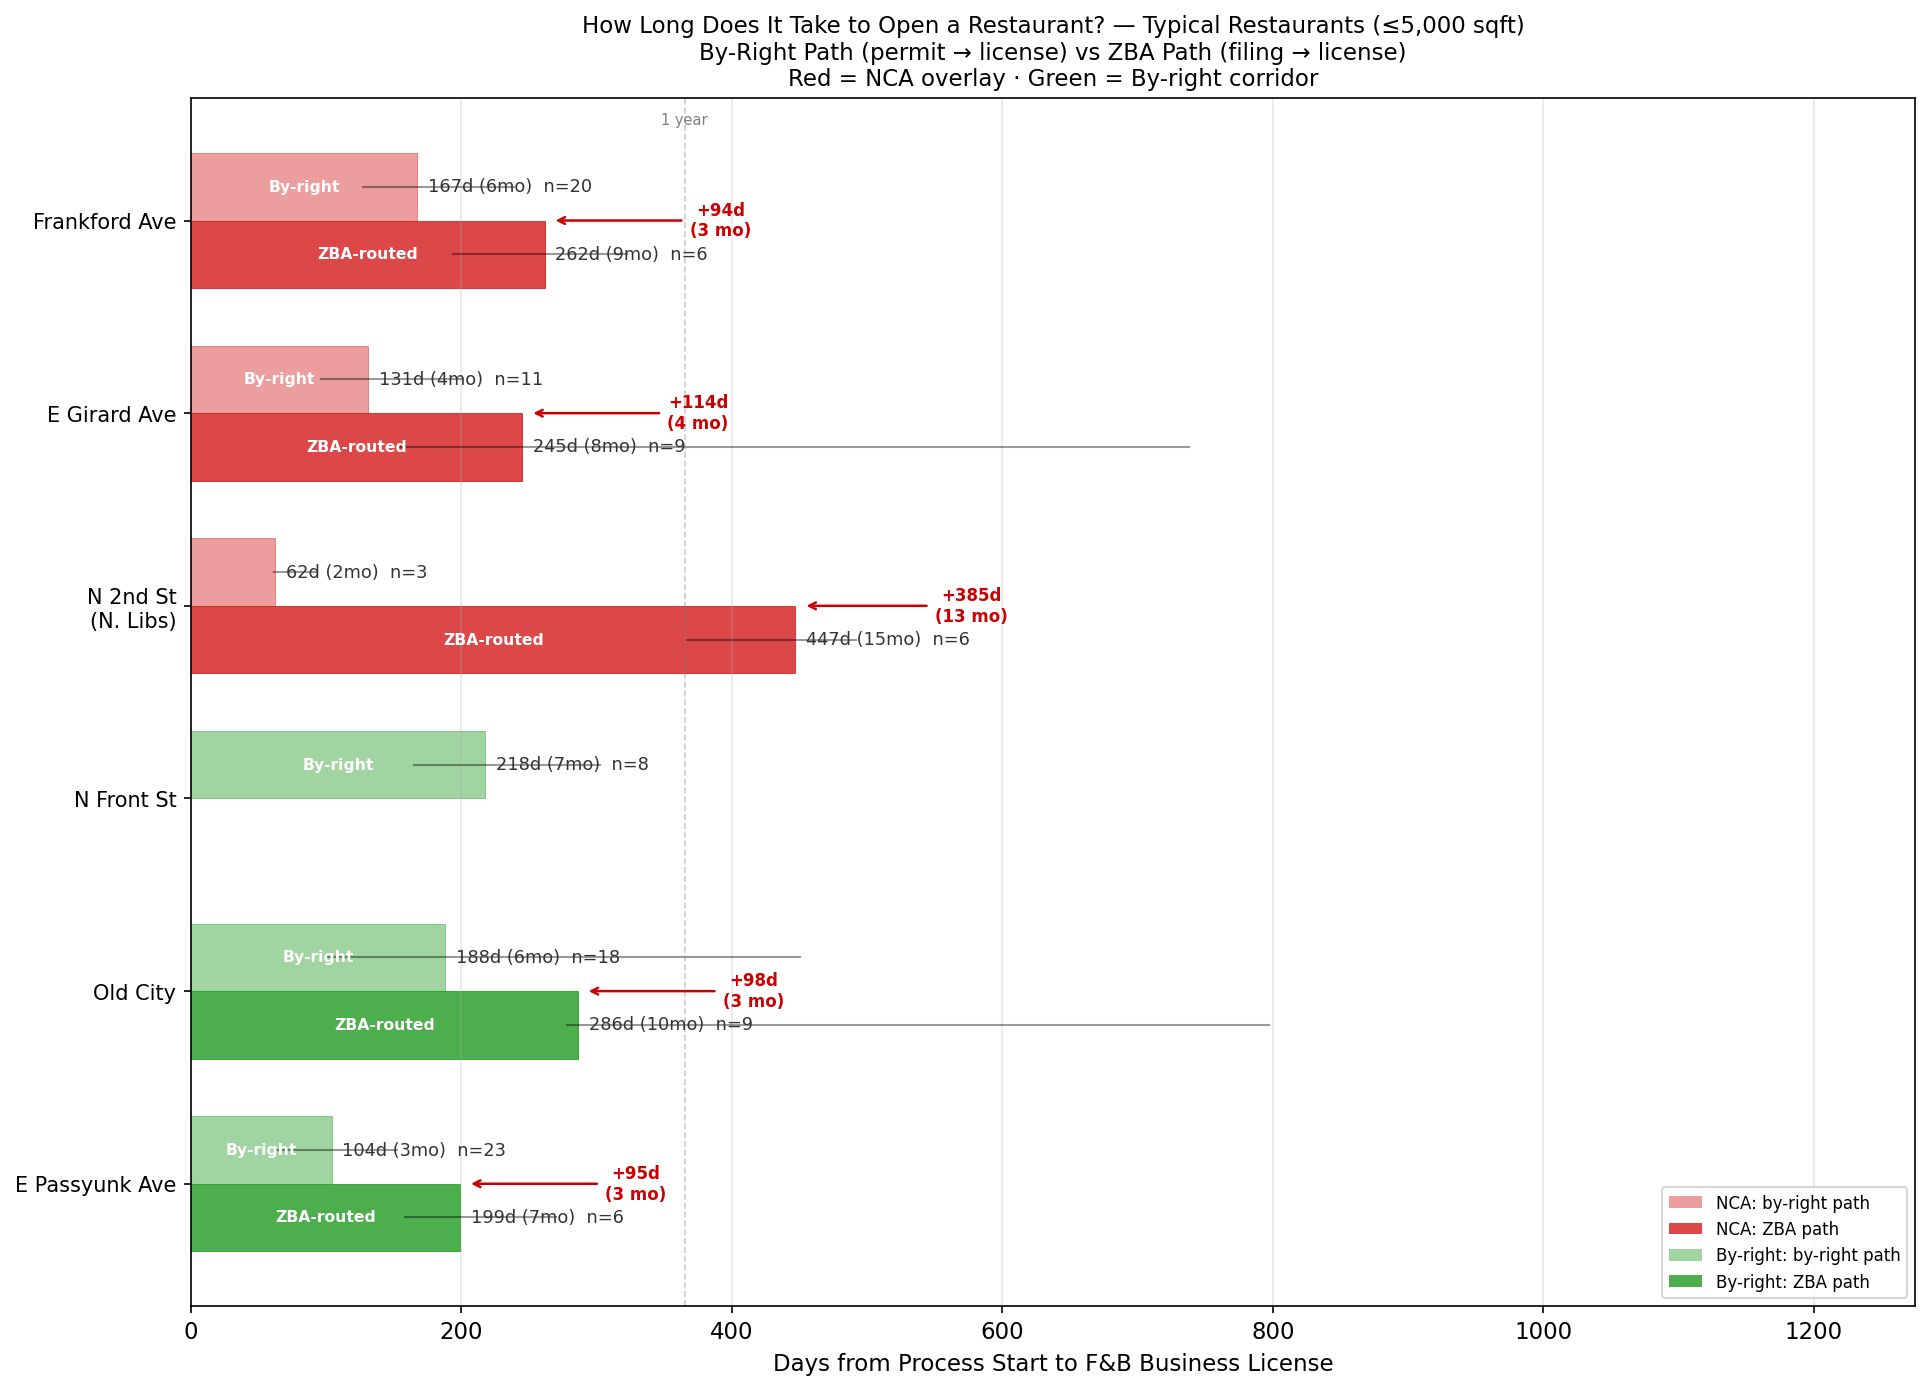
Opening Path — Typical Restaurants (≤5,000 sqft)
Opening Path — Large Projects (>5,000 sqft)
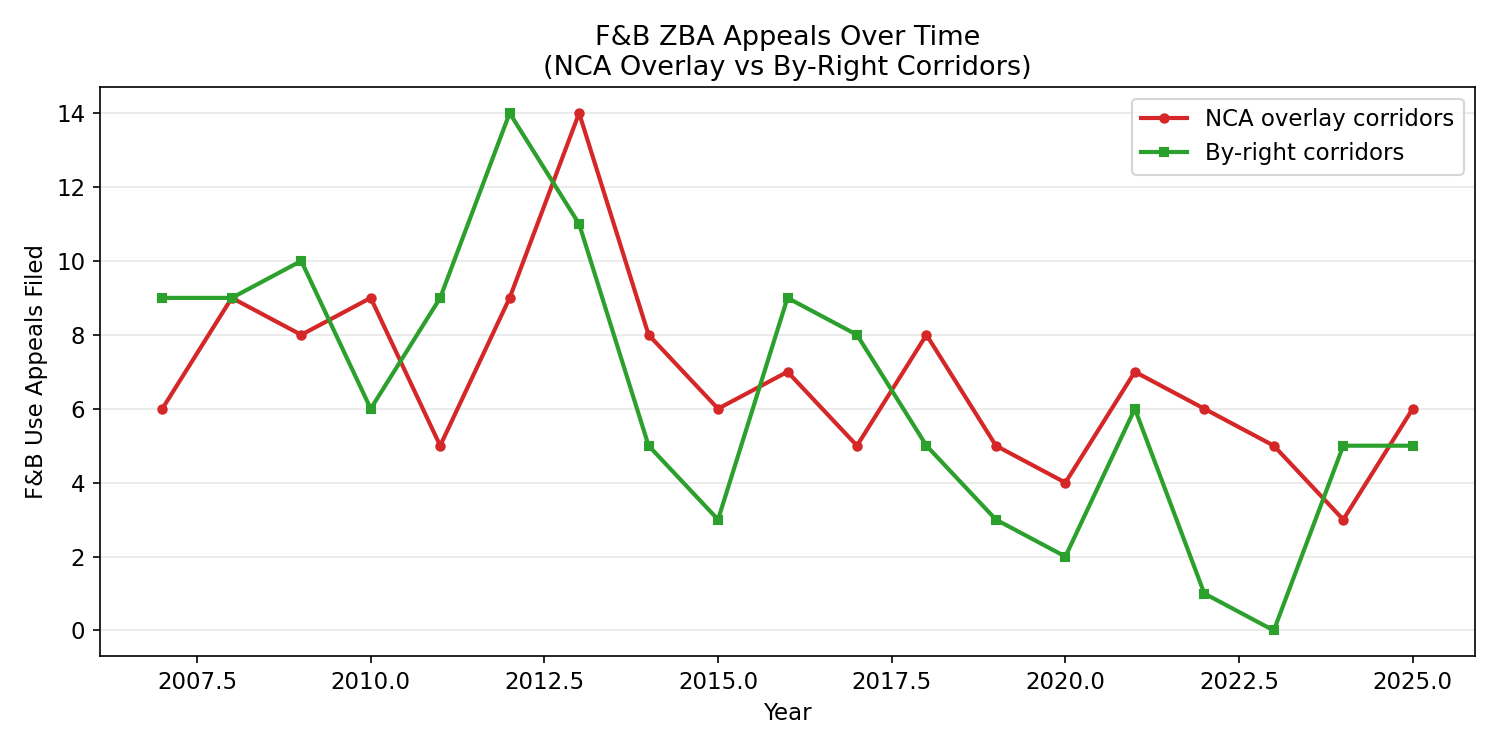
ZBA Caseload Trends
Complaint Trends Over Time
This analysis was produced using public data from the City of Philadelphia's open data portal. All data processing code and a supplementary Excel workbook with record-level data are available for review.
Last updated: February 2026.